Plot Alluvial Plot
AlluviaPlot(
  cellmeta,
  by,
  fill,
  colors = NULL,
  bar.width = 0.5,
  legend.ncol = 1
)
Arguments
- cellmeta
a data frame containing the cell metadata.
- by
a character string specifying the column name in
cellmetawhich will be used to group the cells.- fill
a character string specifying the column name in
cellmetawhich will be used to fill the plot.- colors
(optional) vector of colours to use for filling the plot. If not specified, the default colour scheme will be used.
- bar.width
a numeric value between 0 and 1 specifying the width of the bars in the plot.
- legend.ncol
an integer specifying the number of columns in the legend.
Value
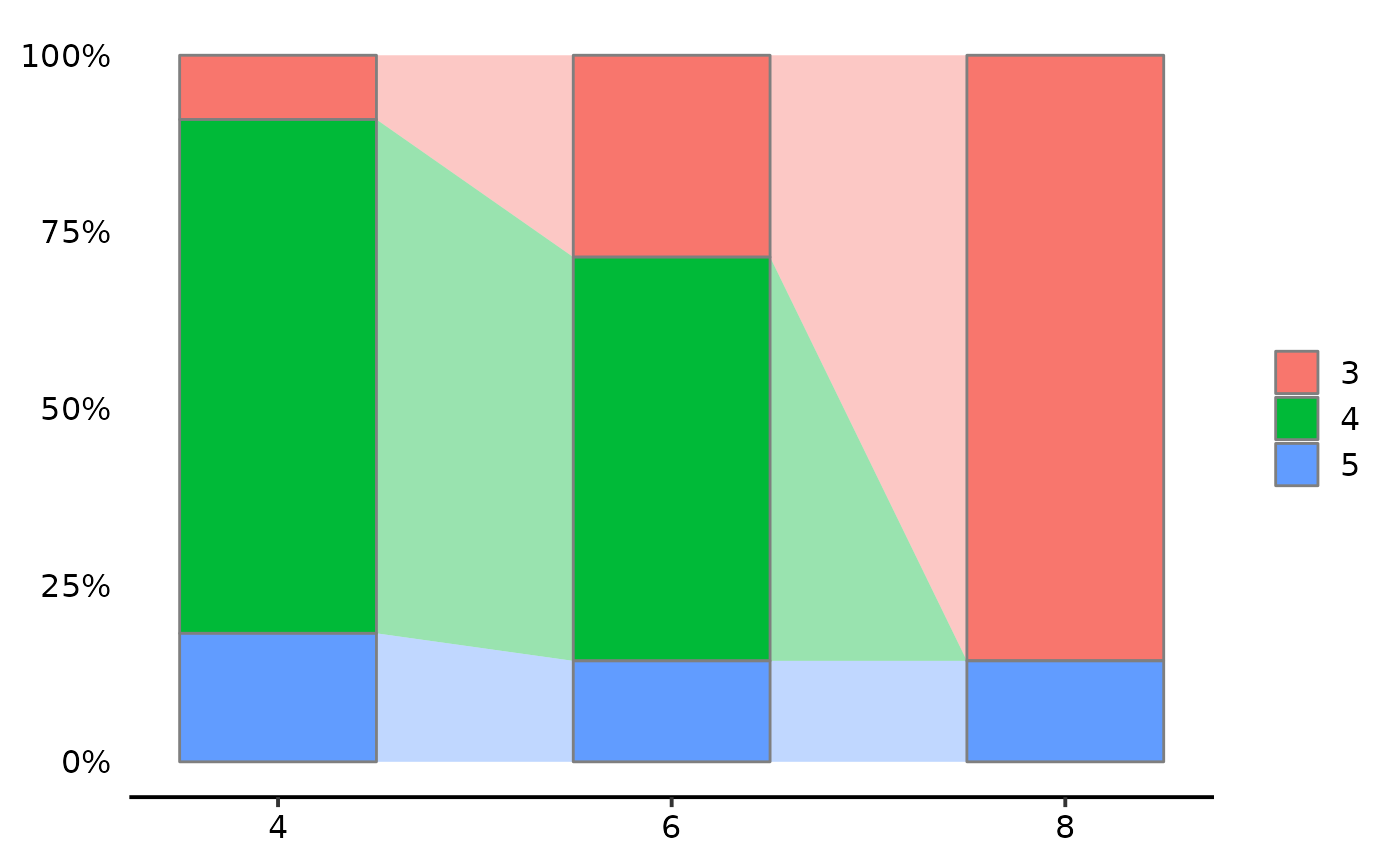
A ggplot object representing an alluvial plot.
References
https://stackoverflow.com/questions/73372641/shaded-area-between-bars-using-ggplot2
Examples
AlluviaPlot(mtcars, "cyl", "gear")
#> Warning: Returning more (or less) than 1 row per `summarise()` group was deprecated in
#> dplyr 1.1.0.
#> ℹ Please use `reframe()` instead.
#> ℹ When switching from `summarise()` to `reframe()`, remember that `reframe()`
#>   always returns an ungrouped data frame and adjust accordingly.
#> ℹ The deprecated feature was likely used in the ProjectSVR package.
#>   Please report the issue at <https://github.com/JarningGau/ProjectSVR/issues>.