Project the Ythdc2-KO germ cells onto mTCA
Compiled: November 06, 2023
Source:vignettes/mapQuery_Ythdc2-KO.Rmd
mapQuery_Ythdc2-KO.RmdWe introduced another example about how to utilize the pre-build reference models of ProjectSVR to map the query data onto the reference.
In the original study 1, the authors collected the purified 4N germ cells from P10 males of heterozygous and homozygous Ythdc2 KO aninmals for scRNA-seq to examine the gene regulation consequences due to loss of Ythdc2. As we known, the 4N germ cells were rare in P10 male mice. So the author pooled cells from two individual mice of the same genotype together to obtain sufficient number of cells, which lead a batch effect from inter samples and can not be corrected directly due to the unknown sample labels (See figure 4B in the original paper). This more or less affects our interpretation of the data.
In this tutorial, we project the Ythdc2-KO and WT germ cells onto the mouse testicular cell atlas (mTCA). We will see that ProjectSVR can correct the batch effect from different individuals naturally although we do not introduce the sample labels to the reference model. This suggest the supported vector regression (SVR) model has good generalization performance.
Download Related Dataset
library(Seurat)
library(ProjectSVR)
library(tidyverse)

options(timeout = max(3600, getOption("timeout")))
# reference model
if (!dir.exists("models")) dir.create("models")
download.file(url = "https://zenodo.org/record/8350732/files/model.mTCA.rds",
              destfile = "models/model.mTCA.rds")
# query data
if (!dir.exists("query")) dir.create("query")
download.file(url = "https://zenodo.org/record/8350748/files/query_Ythdc2-KO.seurat.slim.qs",
              destfile = "query/query_Ythdc2-KO.seurat.slim.qs")
Map Query to Reference
Reference mapping
reference <- readRDS("models/model.mTCA.rds")
seu.q <- qs::qread("query/query_Ythdc2-KO.seurat.slim.qs")

samples <- c("WT", "KO1", "KO2")
names(samples) <- c("GSM5883825", "GSM5883826", "GSM5883827")
seu.q$sample.id <- factor(samples[seu.q$orig.ident], levels = samples)

seu.q <- ProjectSVR::MapQuery(seu.q, reference = reference, add.map.qual = T, ncores = 10)

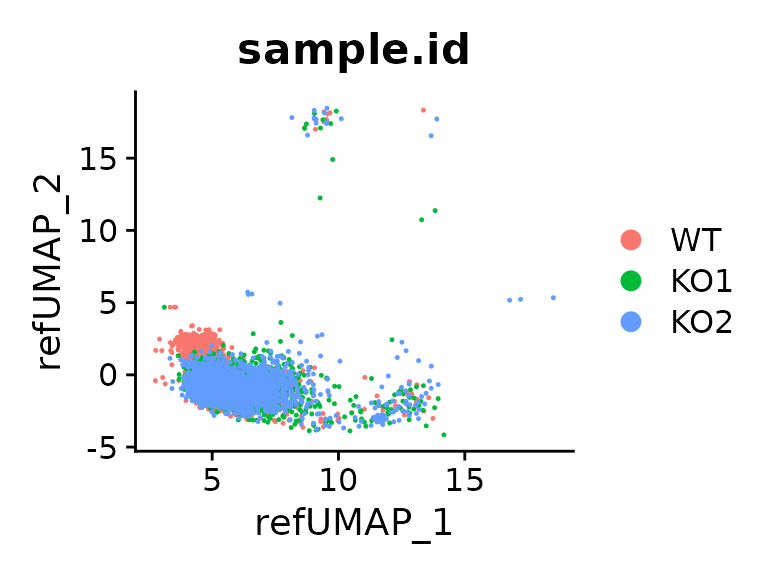
DimPlot(seu.q, reduction = "ref.umap", group.by = "sample.id")
Maping quality
## cutoff by adjusted p value
MapQCPlot(seu.q, p.adj.cutoff = 0.1)
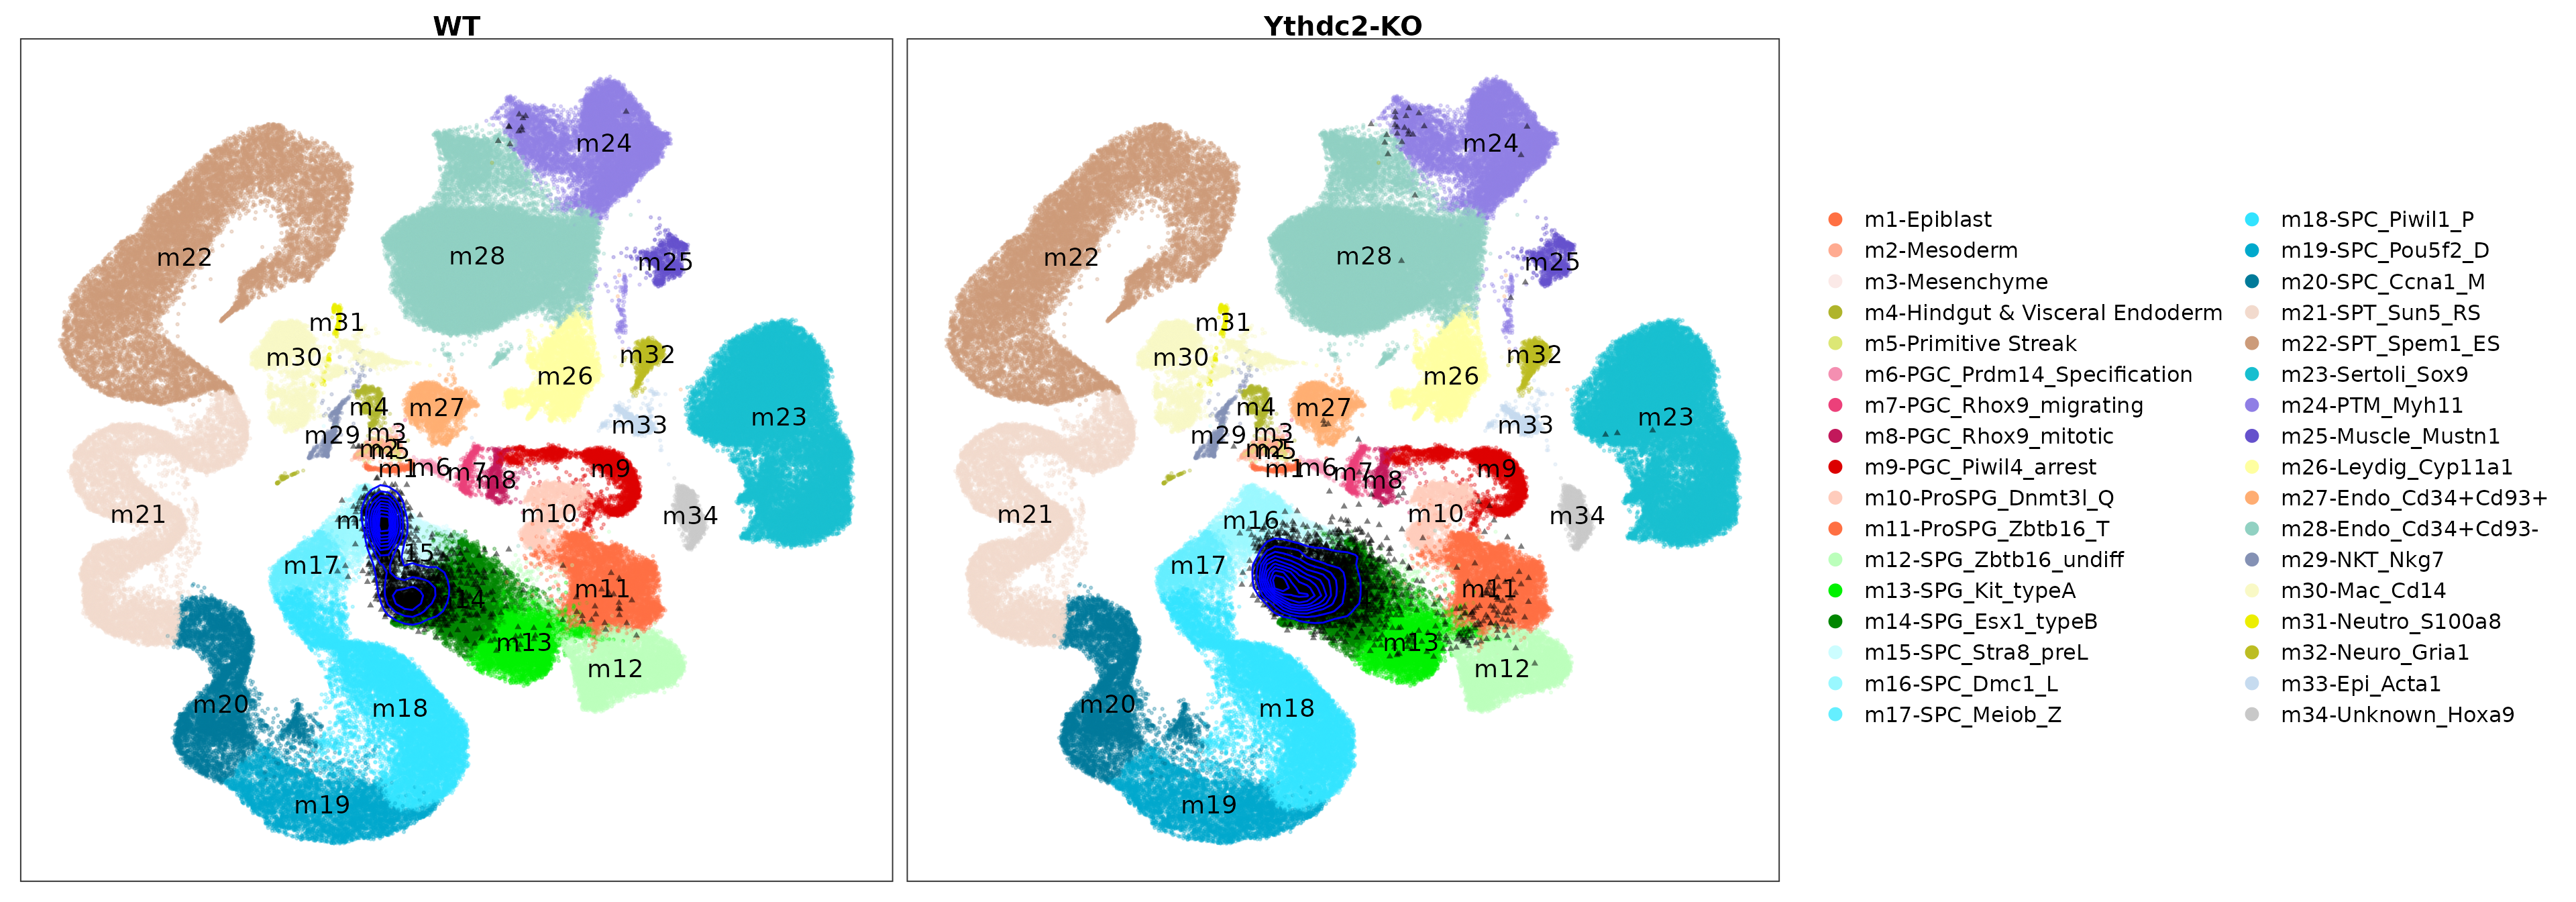
Visualize the projected query cells onto the reference atlas.
PlotProjection(seu.q, reference, split.by = "genotype", ref.color.by = "cell_type",
               ref.size = .5, ref.alpha = .3, query.size = 1, query.alpha = .5,
               n.row = 1, legend.ncol = 2)
Label transfer
seu.q <- subset(seu.q, mapQ.p.adj < 0.1)
seu.q <- ProjectSVR::LabelTransfer(seu.q, reference, ref.label.col = "cell_type")
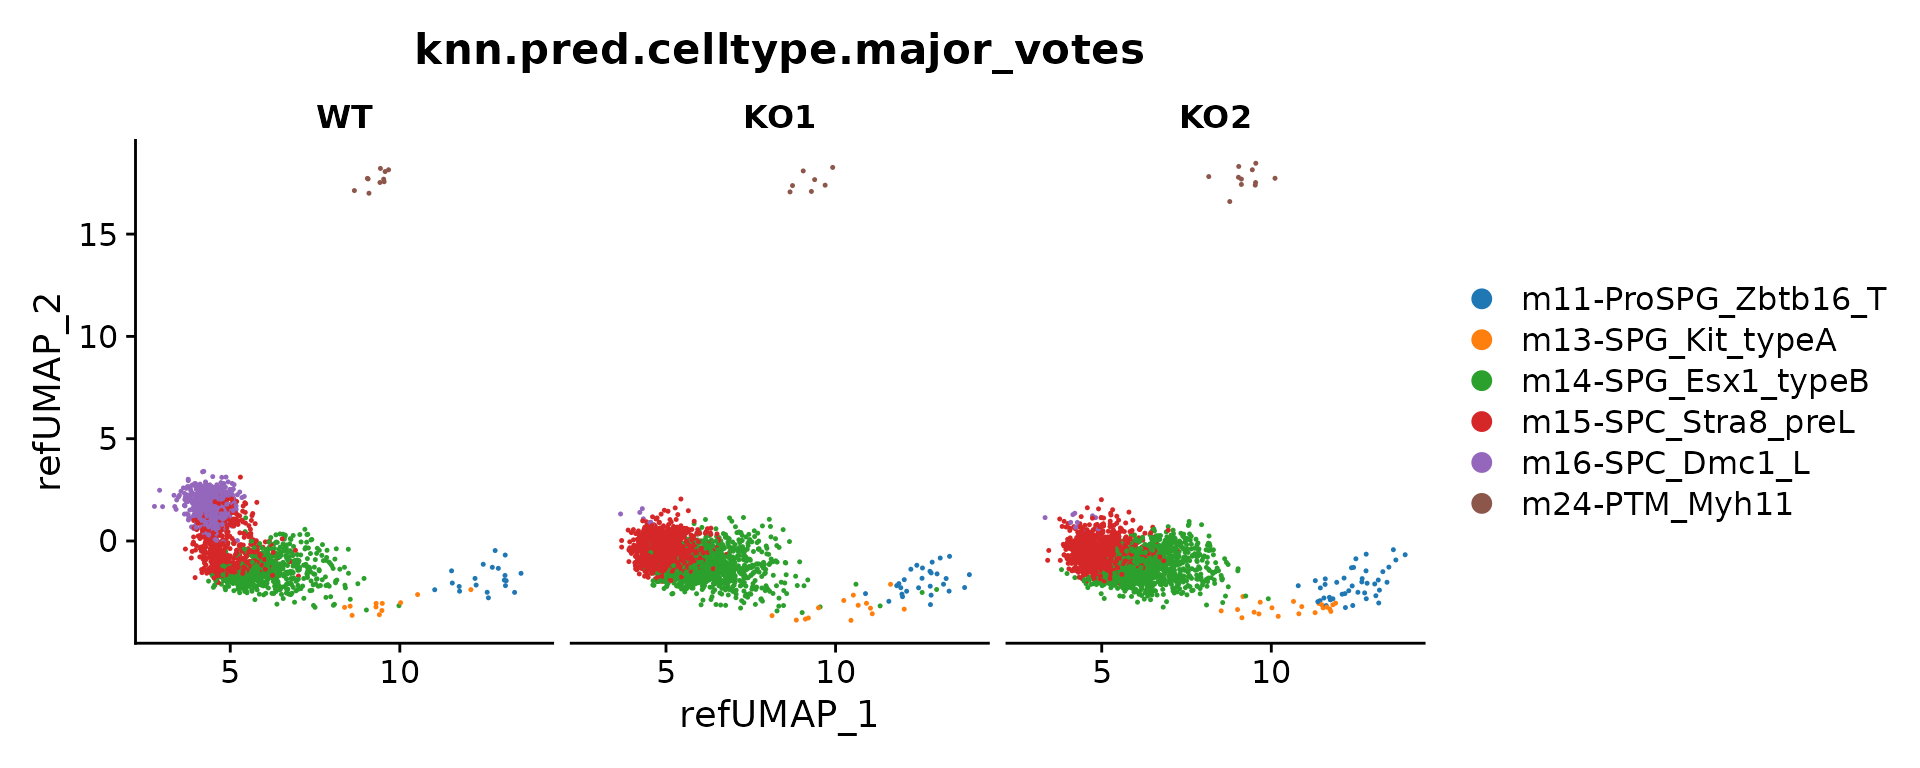
We perform majority vote on a over clustering results by kmeans (on gene set score matrix) to generate the consensus cell annotations.
feature.mat <- FetchData(seu.q, vars = rownames(seu.q))
cell.types <- FetchData(seu.q, vars = c("knn.pred.celltype"))
knn.pred.mv <- MajorityVote(feature.mat = feature.mat, cell.types = cell.types, k = 100, min.prop = 0.3)
seu.q$knn.pred.celltype.major_votes <- knn.pred.mv$knn.pred.celltype.major_votes

DimPlot(seu.q, group.by = "knn.pred.celltype.major_votes", split.by = "sample.id") +
  ggsci::scale_color_d3()
Alluvia plot
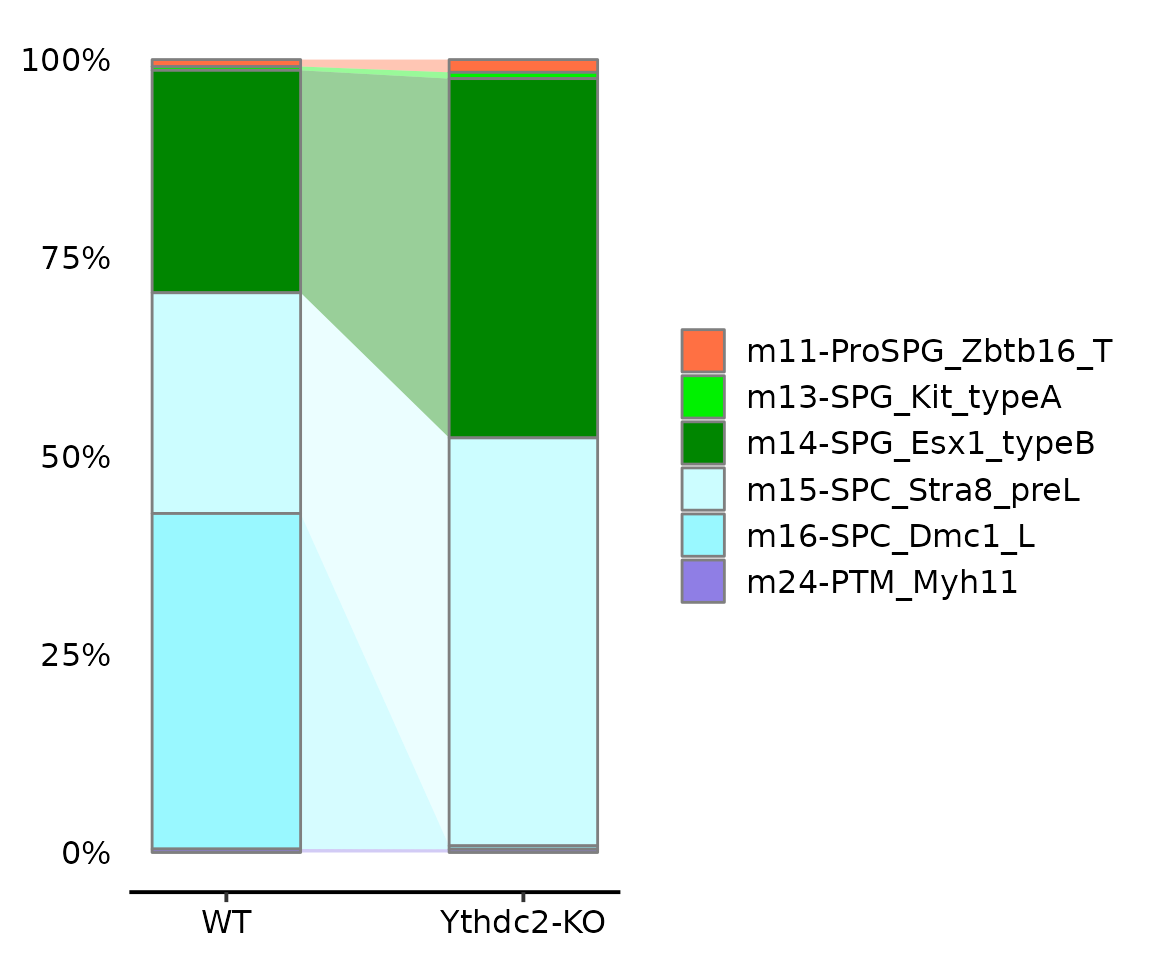
AlluviaPlot(seu.q@meta.data, by = "genotype",
            fill = "knn.pred.celltype.major_votes",
            colors = reference$ref.cellmeta$colors,
            bar.width = .5, legend.ncol = 1)
Session Info
## R version 4.1.2 (2021-11-01)
## Platform: x86_64-pc-linux-gnu (64-bit)
## Running under: Ubuntu 22.04.2 LTS
##
## Matrix products: default
## BLAS:   /usr/lib/x86_64-linux-gnu/blas/libblas.so.3.10.0
## LAPACK: /usr/lib/x86_64-linux-gnu/lapack/liblapack.so.3.10.0
##
## locale:
##  [1] LC_CTYPE=C.UTF-8       LC_NUMERIC=C           LC_TIME=C.UTF-8
##  [4] LC_COLLATE=C.UTF-8     LC_MONETARY=C.UTF-8    LC_MESSAGES=C.UTF-8
##  [7] LC_PAPER=C.UTF-8       LC_NAME=C              LC_ADDRESS=C
## [10] LC_TELEPHONE=C         LC_MEASUREMENT=C.UTF-8 LC_IDENTIFICATION=C
##
## attached base packages:
## [1] stats     graphics  grDevices utils     datasets  methods   base
##
## other attached packages:
##  [1] lubridate_1.9.2    forcats_1.0.0      stringr_1.5.0      dplyr_1.1.3
##  [5] purrr_1.0.2        readr_2.1.4        tidyr_1.3.0        tibble_3.2.1
##  [9] ggplot2_3.4.3      tidyverse_2.0.0    ProjectSVR_0.2.0   SeuratObject_4.1.3
## [13] Seurat_4.3.0.1
##
## loaded via a namespace (and not attached):
##   [1] rappdirs_0.3.3              scattermore_1.2
##   [3] prabclus_2.3-2              R.methodsS3_1.8.2
##   [5] ragg_1.2.5                  bit64_4.0.5
##   [7] knitr_1.43                  DelayedArray_0.20.0
##   [9] irlba_2.3.5.1               R.utils_2.12.2
##  [11] data.table_1.14.8           KEGGREST_1.34.0
##  [13] RCurl_1.98-1.12             doParallel_1.0.17
##  [15] generics_0.1.3              BiocGenerics_0.40.0
##  [17] cowplot_1.1.1               RSQLite_2.3.1
##  [19] RApiSerialize_0.1.2         RANN_2.6.1
##  [21] future_1.33.0               bit_4.0.5
##  [23] tzdb_0.4.0                  spatstat.data_3.0-1
##  [25] httpuv_1.6.11               ggsci_3.0.0
##  [27] isoband_0.2.7               SummarizedExperiment_1.24.0
##  [29] xfun_0.40                   hms_1.1.3
##  [31] jquerylib_0.1.4             evaluate_0.21
##  [33] promises_1.2.1              DEoptimR_1.1-2
##  [35] fansi_1.0.4                 igraph_1.5.1
##  [37] DBI_1.1.3                   htmlwidgets_1.6.2
##  [39] spatstat.geom_3.2-5         stats4_4.1.2
##  [41] ellipsis_0.3.2              mlr3data_0.7.0
##  [43] backports_1.4.1             annotate_1.72.0
##  [45] MatrixGenerics_1.6.0        RcppParallel_5.1.7
##  [47] deldir_1.0-9                vctrs_0.6.3
##  [49] Biobase_2.54.0              here_1.0.1
##  [51] ROCR_1.0-11                 abind_1.4-5
##  [53] cachem_1.0.8                withr_2.5.0
##  [55] mlr3verse_0.2.8             mlr3learners_0.5.6
##  [57] robustbase_0.99-0           progressr_0.14.0
##  [59] checkmate_2.2.0             sctransform_0.3.5
##  [61] mlr3fselect_0.11.0          mclust_6.0.0
##  [63] goftest_1.2-3               cluster_2.1.2
##  [65] lazyeval_0.2.2              crayon_1.5.2
##  [67] spatstat.explore_3.2-3      labeling_0.4.3
##  [69] pkgconfig_2.0.3             GenomeInfoDb_1.30.1
##  [71] nlme_3.1-155                nnet_7.3-17
##  [73] rlang_1.1.1                 globals_0.16.2
##  [75] diptest_0.76-0              lifecycle_1.0.3
##  [77] miniUI_0.1.1.1              palmerpenguins_0.1.1
##  [79] rprojroot_2.0.3             polyclip_1.10-4
##  [81] matrixStats_1.0.0           lmtest_0.9-40
##  [83] graph_1.72.0                Matrix_1.6-1
##  [85] zoo_1.8-12                  ggridges_0.5.4
##  [87] GlobalOptions_0.1.2         png_0.1-8
##  [89] viridisLite_0.4.2           rjson_0.2.21
##  [91] stringfish_0.15.8           bitops_1.0-7
##  [93] R.oo_1.25.0                 KernSmooth_2.23-20
##  [95] Biostrings_2.62.0           blob_1.2.4
##  [97] shape_1.4.6                 paradox_0.11.1
##  [99] parallelly_1.36.0           spatstat.random_3.1-6
## [101] S4Vectors_0.32.4            scales_1.2.1
## [103] memoise_2.0.1               GSEABase_1.56.0
## [105] magrittr_2.0.3              plyr_1.8.8
## [107] ica_1.0-3                   zlibbioc_1.40.0
## [109] compiler_4.1.2              RColorBrewer_1.1-3
## [111] clue_0.3-64                 fitdistrplus_1.1-11
## [113] cli_3.6.1                   XVector_0.34.0
## [115] mlr3tuningspaces_0.4.0      mlr3filters_0.7.1
## [117] listenv_0.9.0               patchwork_1.1.3
## [119] pbapply_1.7-2               MASS_7.3-55
## [121] mlr3hyperband_0.4.5         tidyselect_1.2.0
## [123] stringi_1.7.12              textshaping_0.3.6
## [125] highr_0.10                  yaml_2.3.7
## [127] ggrepel_0.9.3               grid_4.1.2
## [129] sass_0.4.7                  tools_4.1.2
## [131] timechange_0.2.0            mlr3misc_0.12.0
## [133] future.apply_1.11.0         parallel_4.1.2
## [135] mlr3cluster_0.1.8           circlize_0.4.15
## [137] rstudioapi_0.15.0           uuid_1.1-1
## [139] qs_0.25.5                   foreach_1.5.2
## [141] AUCell_1.16.0               gridExtra_2.3
## [143] farver_2.1.1                Rtsne_0.16
## [145] digest_0.6.33               shiny_1.7.5
## [147] fpc_2.2-10                  Rcpp_1.0.11
## [149] GenomicRanges_1.46.1        later_1.3.1
## [151] RcppAnnoy_0.0.21            httr_1.4.7
## [153] AnnotationDbi_1.56.2        mlr3mbo_0.2.1
## [155] mlr3tuning_0.19.0           ComplexHeatmap_2.10.0
## [157] kernlab_0.9-32              colorspace_2.1-0
## [159] XML_3.99-0.14               fs_1.6.3
## [161] tensor_1.5                  reticulate_1.31
## [163] IRanges_2.28.0              splines_4.1.2
## [165] lgr_0.4.4                   uwot_0.1.16
## [167] bbotk_0.7.2                 spatstat.utils_3.0-3
## [169] pkgdown_2.0.7               sp_2.0-0
## [171] mlr3pipelines_0.5.0-1       flexmix_2.3-19
## [173] plotly_4.10.2               systemfonts_1.0.4
## [175] xtable_1.8-4                jsonlite_1.8.7
## [177] modeltools_0.2-23           R6_2.5.1
## [179] pillar_1.9.0                htmltools_0.5.6
## [181] mime_0.12                   glue_1.6.2
## [183] fastmap_1.1.1               mlr3_0.16.1
## [185] class_7.3-20                codetools_0.2-18
## [187] spacefillr_0.3.2            utf8_1.2.3
## [189] lattice_0.20-45             bslib_0.5.1
## [191] spatstat.sparse_3.0-2       leiden_0.4.3
## [193] mlr3viz_0.6.1               survival_3.2-13
## [195] rmarkdown_2.24              desc_1.4.2
## [197] munsell_0.5.0               GetoptLong_1.0.5
## [199] GenomeInfoDbData_1.2.7      iterators_1.0.14
## [201] reshape2_1.4.4              gtable_0.3.4