Project the perturbed germ cells onto mouse testicular cell atlas
Compiled: November 06, 2023
Source:vignettes/mapQuery_Zfp541-KO.Rmd
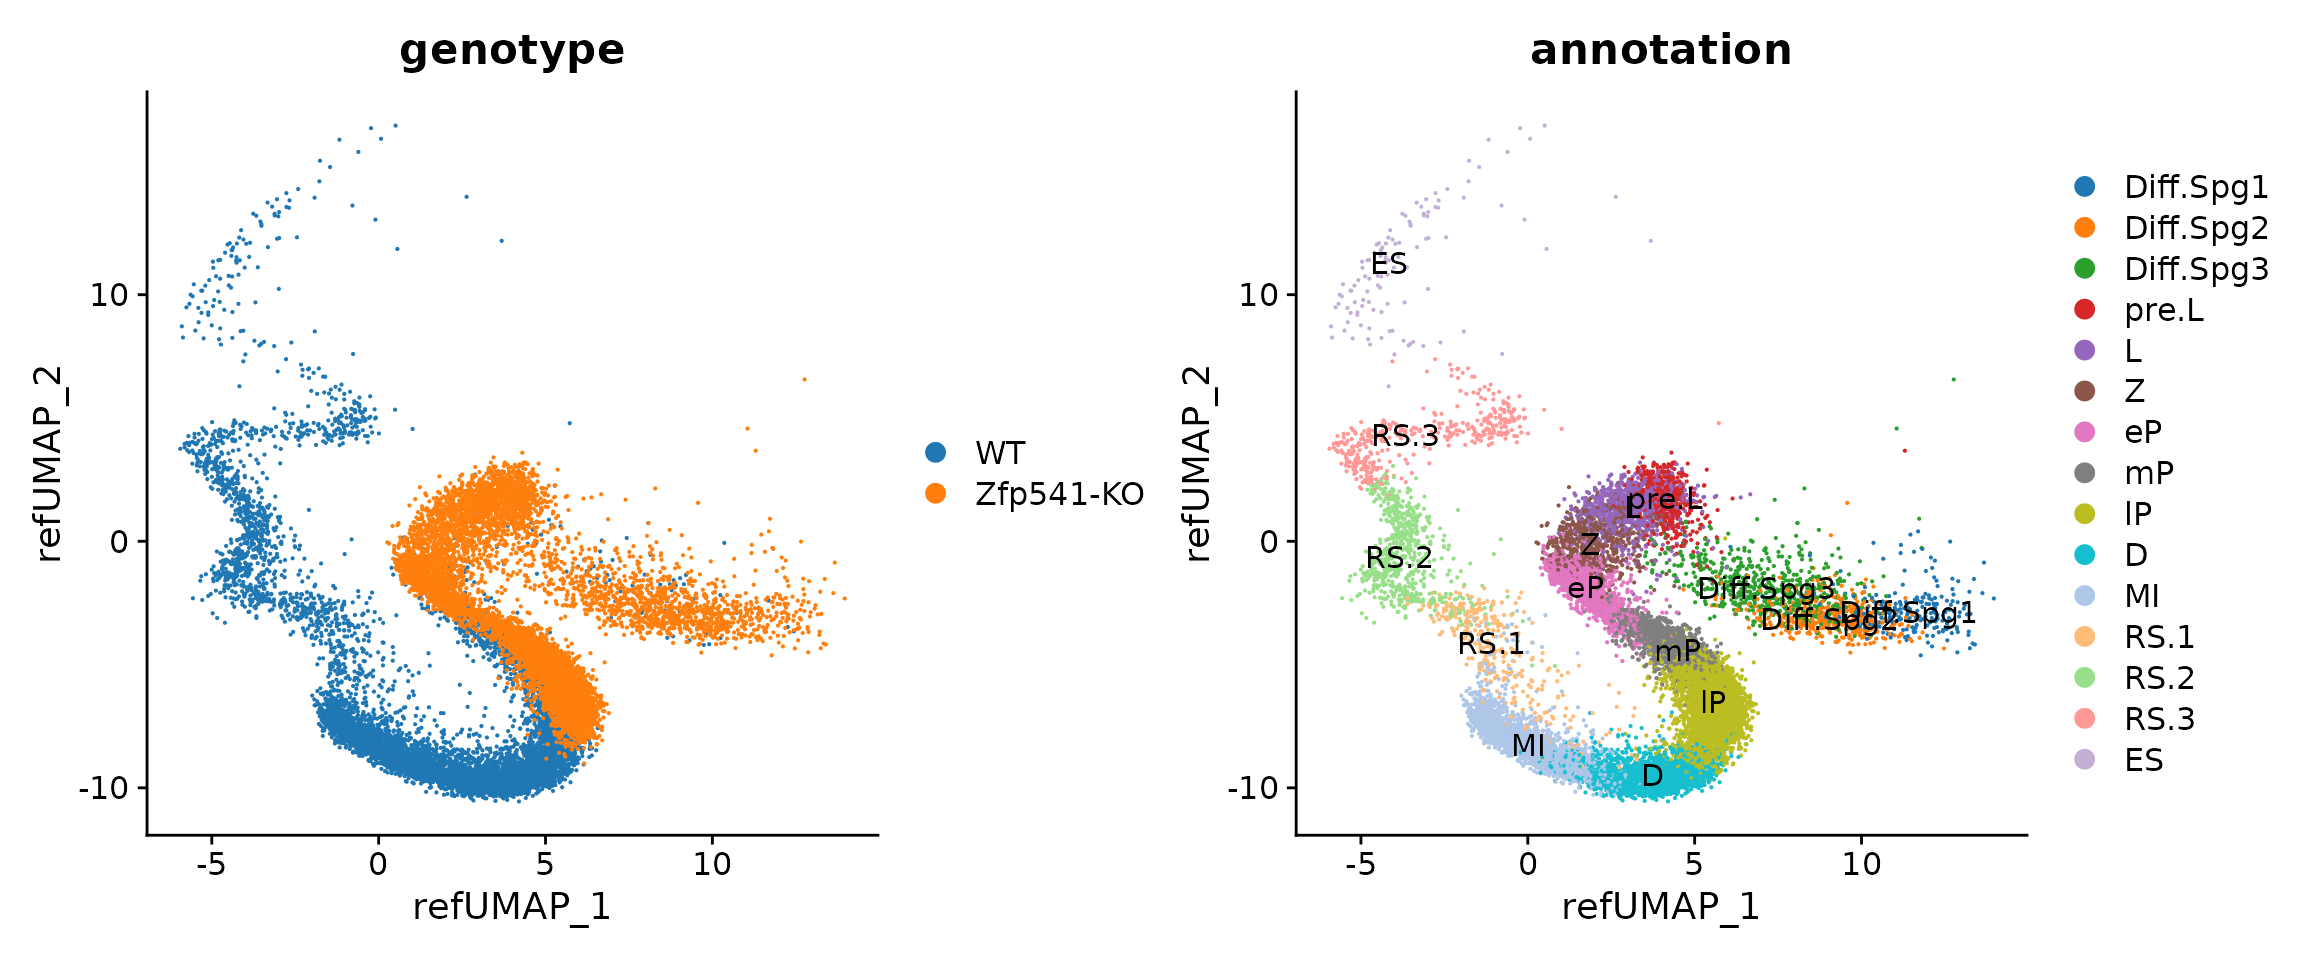
mapQuery_Zfp541-KO.RmdTo illustrate ProjectSVR’s ability to enable the interpretation of defects of perturbed stages in a continuous developmental trajectory. Here, we provide a tutorial about how to project Zfp541-KO and WT germ cells 1 onto mouse testicular cell atlas using a pre-build model.
In this tutorial, we do not utilize the advanced wrapper functions
(MapQuery and LabelTransfer) to illustrate how
to use the low level functions.
Download Related Dataset
library(Seurat)
library(ProjectSVR)
library(tidyverse)

options(timeout = max(3600, getOption("timeout")))
# reference model
if (!dir.exists("models")) dir.create("models")
download.file(url = "https://zenodo.org/record/8350732/files/model.mTCA.rds",
              destfile = "models/model.mTCA.rds")
# query data
if (!dir.exists("query")) dir.create("query")
download.file(url = "https://zenodo.org/record/8350748/files/query_Zfp541-KO.seurat.slim.qs",
              destfile = "query/query_Zfp541-KO.seurat.slim.qs")
Map Query to Reference
Reference mapping
reference <- readRDS("models/model.mTCA.rds")
seu.q <- qs::qread("query/query_Zfp541-KO.seurat.slim.qs")

genotype <- c("WT", "Zfp541-KO")
names(genotype) <- c("WT", "Z541")
seu.q$genotype <- factor(genotype[seu.q$orig.ident], levels = genotype)

## transform the counts matrix to gene set score matrix for query data
reference$gss.method # The reference model utilizes `AUCell` for gene set scoring.
## [1] "AUCell"
top.genes <- reference$genes$gene.sets
gss.mat <- ComputeModuleScore(seu.q[["RNA"]]@data, gene.sets = top.genes, method = "AUCell", cores = 10)

## Project query into reference's UMAP spaces using gene set score matrix.
proj.res <- ProjectNewdata(feature.mat = gss.mat, model = reference$models$umap, cores = 10)
## Returning a `CellProject` object.
proj.res
## An object of class CellProject
## @data: 70 features across 17253 cells.
## @embeddings: ( 17253 , 2 ).
## @refined.embeddings: ( 0 , 0 ).
## @cellmeta: ( 17253 , 0 ).
## @neighbors: NULL
## write the projected embeddings to original seurat object
seu.q[["ref.umap"]] <- CreateDimReducObject(proj.res@embeddings, key = "refUMAP_", assay = "RNA")

## visualization
p1 <- DimPlot(seu.q, reduction = "ref.umap", group.by = "genotype")
p2 <- DimPlot(seu.q, reduction = "ref.umap", group.by = "annotation", label = T) # original cell labels
(p1 + p2) & ggsci::scale_color_d3("category20")
Mapping quality
## calculate the map quanlity metrics (mean.knn.dist)
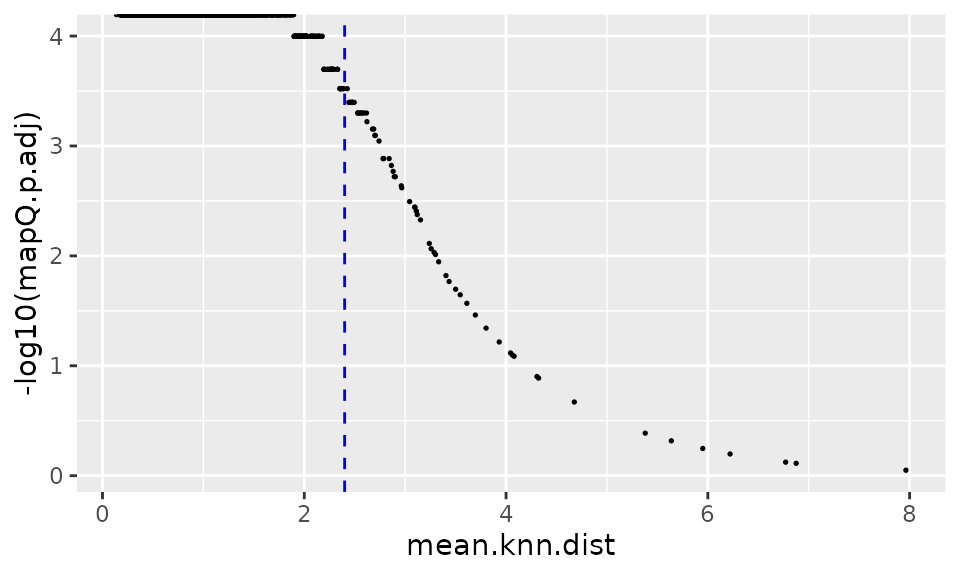
proj.res <- AddProjQual(object = proj.res, k = 20, repeats = 1e4)
head(proj.res@cellmeta)
## mean.knn.dist p.val p.adj
## WT_AAACCCAAGCGATCGA-1 0.4955652 0 0
## WT_AAACCCAAGCTAGAAT-1 0.3168841 0 0
## WT_AAACCCACAACGGTAG-1 0.5385500 0 0
## WT_AAACCCACAATATCCG-1 0.6730108 0 0
## WT_AAACCCACAGGCGATA-1 0.3341204 0 0
## WT_AAACCCACATATGGCT-1 0.4219758 0 0
## store the results in original seurat object
seu.q$mean.knn.dist <- proj.res@cellmeta$mean.knn.dist
seu.q$mapQ.p.val <- proj.res@cellmeta$p.val
seu.q$mapQ.p.adj <- proj.res@cellmeta$p.adj

## visualization
data.plot <- FetchData(seu.q, vars = c(paste0("refUMAP_", 1:2), "mean.knn.dist", "mapQ.p.adj"))

ggplot(data.plot, aes(mean.knn.dist, -log10(mapQ.p.adj))) +
  geom_point(size = .3) +
  geom_vline(xintercept = 2.4, linetype = "dashed", color = "blue")
## cutoff by adjusted p value
MapQCPlot(seu.q, p.adj.cutoff = 1e-3)
## or mean.knn.dist
MapQCPlot(seu.q, map.q.cutoff = 2.4)
Label transfer
## drop the low-quality mapped cells
seu.q <- subset(seu.q, mean.knn.dist < 2.4)

## input for KNN label transfer
ref.cellmeta <- reference$ref.cellmeta$meta.data
# reference cell embeddings
ref.emb <- ref.cellmeta[, paste0("UMAP_", 1:2)]
# reference cell labels
ref.labels <- ref.cellmeta[["cell_type"]]
names(ref.labels) <- rownames(ref.cellmeta)
# query cell embeddings
query.emb <- seu.q[["ref.umap"]]@cell.embeddings

## KNN label transfer
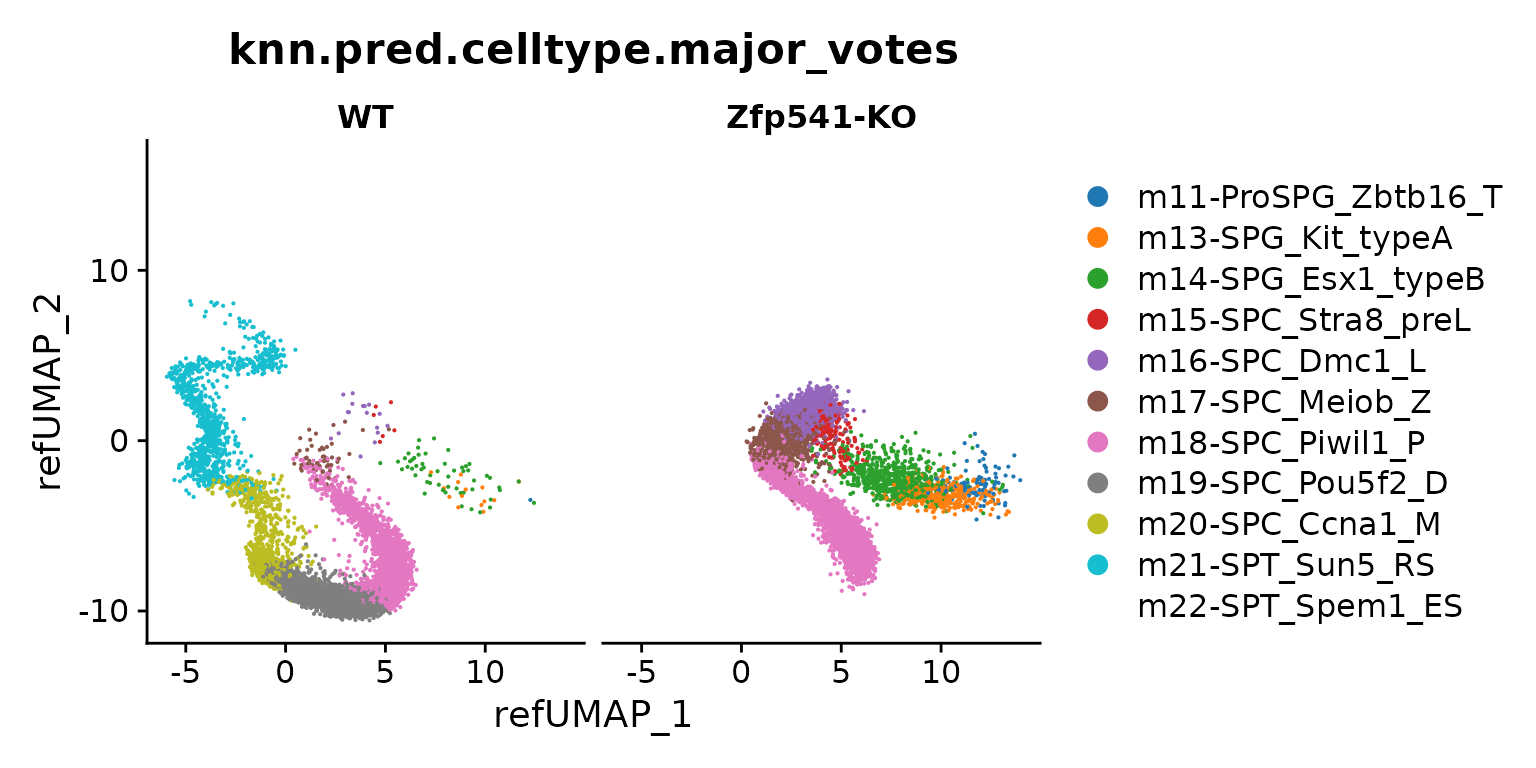
knn.pred.res <- KnnLabelTransfer(query.emb = query.emb, ref.emb = ref.emb,
                                 ref.labels = ref.labels, k = 100)
## over-cluster and then performing majority voting for each clusters
knn.pred.mv <- MajorityVote(feature.mat = gss.mat,
                            cell.types = knn.pred.res[, c("labels"), drop = F],
                            k = 100, min.prop = 0.3)

## save results to seurat object
seu.q$knn.pred.celltype <- knn.pred.res$labels
seu.q$knn.pred.celltype.major_votes <- knn.pred.mv$labels.major_votes
ref.celltype.levels <- levels(ref.cellmeta[["cell_type"]])
seu.q$knn.pred.celltype <- factor(seu.q$knn.pred.celltype, levels = ref.celltype.levels)
seu.q$knn.pred.celltype.major_votes <- factor(seu.q$knn.pred.celltype.major_votes,
                                              levels = ref.celltype.levels)

DimPlot(seu.q, reduction = "ref.umap", group.by = "knn.pred.celltype.major_votes",
        split.by = "genotype") + ggsci::scale_color_d3()
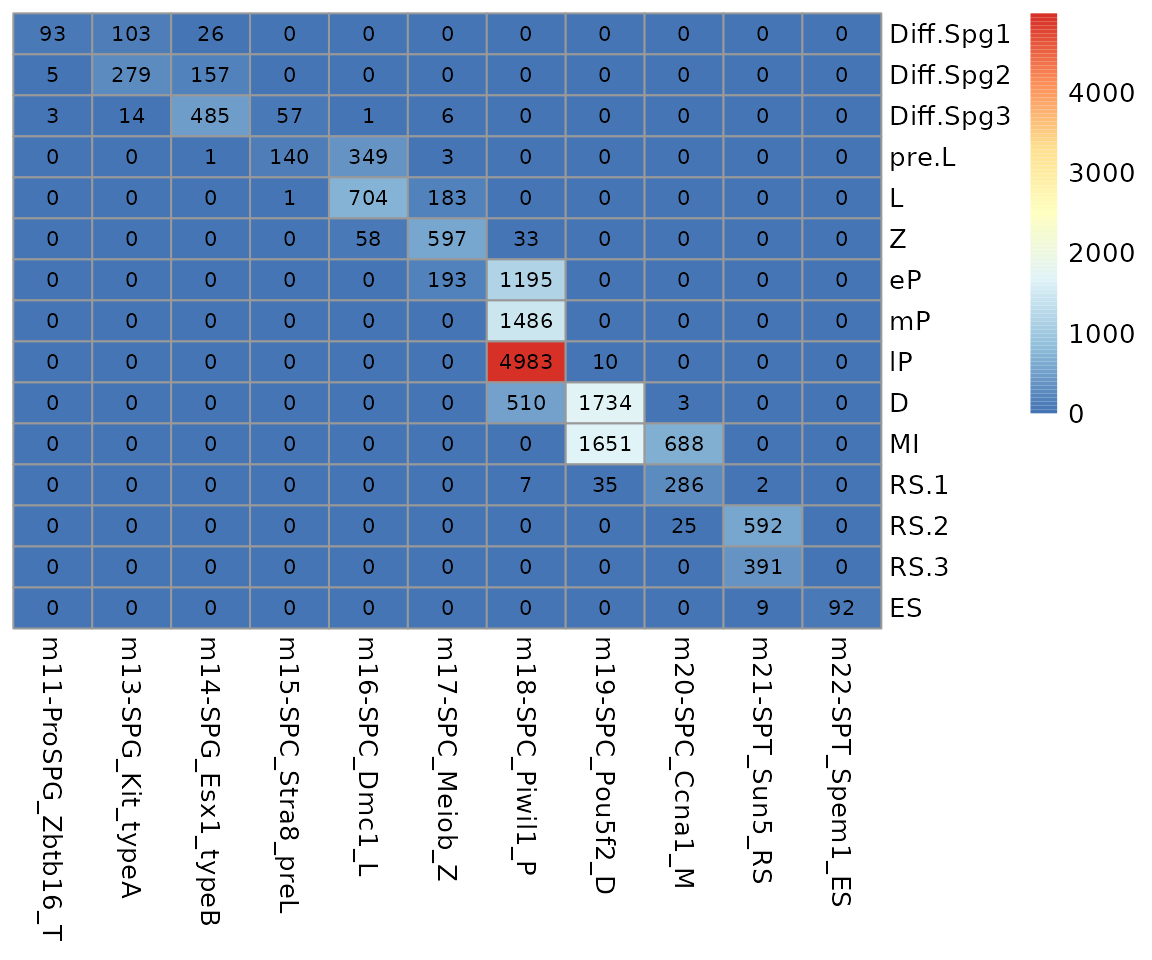
data.stat <- table(seu.q$annotation, seu.q$knn.pred.celltype.major_votes)
data.stat <- data.stat[, colSums(data.stat) > 0]

pheatmap::pheatmap(data.stat, display_numbers = T, number_format = "%.0f",
                   cluster_rows = F, cluster_cols = F,
                   number_color = "black")
Session Info
## R version 4.1.2 (2021-11-01)
## Platform: x86_64-pc-linux-gnu (64-bit)
## Running under: Ubuntu 22.04.2 LTS
##
## Matrix products: default
## BLAS:   /usr/lib/x86_64-linux-gnu/blas/libblas.so.3.10.0
## LAPACK: /usr/lib/x86_64-linux-gnu/lapack/liblapack.so.3.10.0
##
## locale:
##  [1] LC_CTYPE=C.UTF-8       LC_NUMERIC=C           LC_TIME=C.UTF-8
##  [4] LC_COLLATE=C.UTF-8     LC_MONETARY=C.UTF-8    LC_MESSAGES=C.UTF-8
##  [7] LC_PAPER=C.UTF-8       LC_NAME=C              LC_ADDRESS=C
## [10] LC_TELEPHONE=C         LC_MEASUREMENT=C.UTF-8 LC_IDENTIFICATION=C
##
## attached base packages:
## [1] stats     graphics  grDevices utils     datasets  methods   base
##
## other attached packages:
##  [1] lubridate_1.9.2    forcats_1.0.0      stringr_1.5.0      dplyr_1.1.3
##  [5] purrr_1.0.2        readr_2.1.4        tidyr_1.3.0        tibble_3.2.1
##  [9] ggplot2_3.4.3      tidyverse_2.0.0    ProjectSVR_0.2.0   SeuratObject_4.1.3
## [13] Seurat_4.3.0.1
##
## loaded via a namespace (and not attached):
##   [1] rappdirs_0.3.3              scattermore_1.2
##   [3] prabclus_2.3-2              R.methodsS3_1.8.2
##   [5] ragg_1.2.5                  bit64_4.0.5
##   [7] knitr_1.43                  DelayedArray_0.20.0
##   [9] irlba_2.3.5.1               R.utils_2.12.2
##  [11] data.table_1.14.8           KEGGREST_1.34.0
##  [13] RCurl_1.98-1.12             doParallel_1.0.17
##  [15] generics_0.1.3              BiocGenerics_0.40.0
##  [17] cowplot_1.1.1               RSQLite_2.3.1
##  [19] RApiSerialize_0.1.2         RANN_2.6.1
##  [21] future_1.33.0               bit_4.0.5
##  [23] tzdb_0.4.0                  spatstat.data_3.0-1
##  [25] httpuv_1.6.11               ggsci_3.0.0
##  [27] SummarizedExperiment_1.24.0 xfun_0.40
##  [29] hms_1.1.3                   jquerylib_0.1.4
##  [31] evaluate_0.21               promises_1.2.1
##  [33] DEoptimR_1.1-2              fansi_1.0.4
##  [35] igraph_1.5.1                DBI_1.1.3
##  [37] htmlwidgets_1.6.2           spatstat.geom_3.2-5
##  [39] stats4_4.1.2                ellipsis_0.3.2
##  [41] mlr3data_0.7.0              backports_1.4.1
##  [43] annotate_1.72.0             MatrixGenerics_1.6.0
##  [45] RcppParallel_5.1.7          deldir_1.0-9
##  [47] vctrs_0.6.3                 Biobase_2.54.0
##  [49] here_1.0.1                  ROCR_1.0-11
##  [51] abind_1.4-5                 cachem_1.0.8
##  [53] withr_2.5.0                 mlr3verse_0.2.8
##  [55] mlr3learners_0.5.6          robustbase_0.99-0
##  [57] progressr_0.14.0            checkmate_2.2.0
##  [59] sctransform_0.3.5           mlr3fselect_0.11.0
##  [61] mclust_6.0.0                goftest_1.2-3
##  [63] cluster_2.1.2               lazyeval_0.2.2
##  [65] crayon_1.5.2                spatstat.explore_3.2-3
##  [67] labeling_0.4.3              pkgconfig_2.0.3
##  [69] GenomeInfoDb_1.30.1         nlme_3.1-155
##  [71] nnet_7.3-17                 rlang_1.1.1
##  [73] globals_0.16.2              diptest_0.76-0
##  [75] lifecycle_1.0.3             miniUI_0.1.1.1
##  [77] palmerpenguins_0.1.1        rprojroot_2.0.3
##  [79] polyclip_1.10-4             matrixStats_1.0.0
##  [81] lmtest_0.9-40               graph_1.72.0
##  [83] Matrix_1.6-1                zoo_1.8-12
##  [85] pheatmap_1.0.12             ggridges_0.5.4
##  [87] GlobalOptions_0.1.2         png_0.1-8
##  [89] viridisLite_0.4.2           rjson_0.2.21
##  [91] stringfish_0.15.8           bitops_1.0-7
##  [93] R.oo_1.25.0                 KernSmooth_2.23-20
##  [95] Biostrings_2.62.0           blob_1.2.4
##  [97] shape_1.4.6                 paradox_0.11.1
##  [99] parallelly_1.36.0           spatstat.random_3.1-6
## [101] S4Vectors_0.32.4            scales_1.2.1
## [103] memoise_2.0.1               GSEABase_1.56.0
## [105] magrittr_2.0.3              plyr_1.8.8
## [107] ica_1.0-3                   zlibbioc_1.40.0
## [109] compiler_4.1.2              RColorBrewer_1.1-3
## [111] clue_0.3-64                 fitdistrplus_1.1-11
## [113] cli_3.6.1                   XVector_0.34.0
## [115] mlr3tuningspaces_0.4.0      mlr3filters_0.7.1
## [117] listenv_0.9.0               patchwork_1.1.3
## [119] pbapply_1.7-2               MASS_7.3-55
## [121] mlr3hyperband_0.4.5         tidyselect_1.2.0
## [123] stringi_1.7.12              textshaping_0.3.6
## [125] highr_0.10                  yaml_2.3.7
## [127] ggrepel_0.9.3               grid_4.1.2
## [129] sass_0.4.7                  tools_4.1.2
## [131] timechange_0.2.0            mlr3misc_0.12.0
## [133] future.apply_1.11.0         parallel_4.1.2
## [135] mlr3cluster_0.1.8           circlize_0.4.15
## [137] rstudioapi_0.15.0           uuid_1.1-1
## [139] qs_0.25.5                   foreach_1.5.2
## [141] AUCell_1.16.0               gridExtra_2.3
## [143] farver_2.1.1                Rtsne_0.16
## [145] digest_0.6.33               shiny_1.7.5
## [147] fpc_2.2-10                  Rcpp_1.0.11
## [149] GenomicRanges_1.46.1        later_1.3.1
## [151] RcppAnnoy_0.0.21            httr_1.4.7
## [153] AnnotationDbi_1.56.2        mlr3mbo_0.2.1
## [155] mlr3tuning_0.19.0           ComplexHeatmap_2.10.0
## [157] kernlab_0.9-32              colorspace_2.1-0
## [159] XML_3.99-0.14               fs_1.6.3
## [161] tensor_1.5                  reticulate_1.31
## [163] IRanges_2.28.0              splines_4.1.2
## [165] lgr_0.4.4                   uwot_0.1.16
## [167] bbotk_0.7.2                 spatstat.utils_3.0-3
## [169] pkgdown_2.0.7               sp_2.0-0
## [171] mlr3pipelines_0.5.0-1       flexmix_2.3-19
## [173] plotly_4.10.2               systemfonts_1.0.4
## [175] xtable_1.8-4                jsonlite_1.8.7
## [177] modeltools_0.2-23           R6_2.5.1
## [179] pillar_1.9.0                htmltools_0.5.6
## [181] mime_0.12                   glue_1.6.2
## [183] fastmap_1.1.1               mlr3_0.16.1
## [185] class_7.3-20                codetools_0.2-18
## [187] spacefillr_0.3.2            utf8_1.2.3
## [189] lattice_0.20-45             bslib_0.5.1
## [191] spatstat.sparse_3.0-2       leiden_0.4.3
## [193] mlr3viz_0.6.1               survival_3.2-13
## [195] rmarkdown_2.24              desc_1.4.2
## [197] munsell_0.5.0               GetoptLong_1.0.5
## [199] GenomeInfoDbData_1.2.7      iterators_1.0.14
## [201] reshape2_1.4.4              gtable_0.3.4