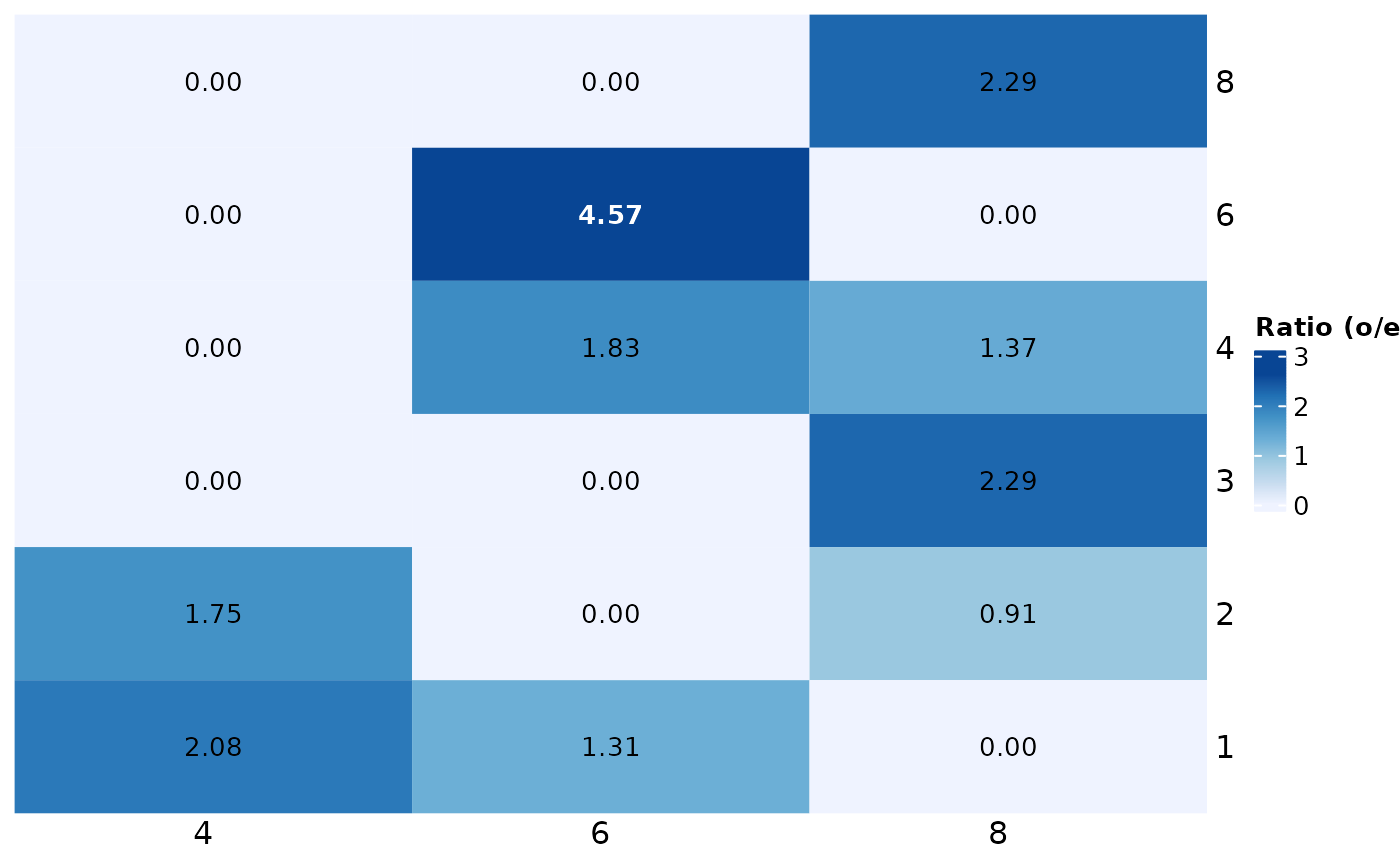
A function to create a heatmap that displays the O/E ratio of a two-column table grouped by a selected column.
GroupPreferencePlot(
  cellmeta,
  group.by,
  preference.on,
  palette = "Blues",
  column_names_rot = 0,
  ...
)
Arguments
- cellmeta
A data frame.
- group.by
A character string indicating the name of the column in `cellmeta` used for grouping.
- preference.on
A character string indicating the name of the column in `cellmeta` used for calculating O/E ratio.
- palette
A color palette to use in the plot. Default is "Blues".
- column_names_rot
degree (0-360) to rotate x-axis labels. Default is 0.
- ...
additional arguments passed to the 'Heatmap' function from ComplexHeatmap package.
Value
A heatmap that displays the O/E ratio of a two-column table grouped by a selected column.